In and Out of Inside Out
On Monday Inside Out West Midlands broadcast their report on cycling around Birmingham which featured talking about my Birmingham Cycle Data site but also getting on my bike and checking out facilities for cyclists around the city. This road footage was inspired by my previous excursions with a Flip.
The BBC filming was an invaluable experience but for me it highlighted the difference between how you can allow a story to develop online compared with needing to have elements pre-defined when you start filming. My challenge for Inside Out was based around a FOI request and inquiry with City Council’s press office as to the amount of cycling improvements that had been made in the last few years. I then hit the road to see how the improvements had been installed.
Obviously, filming time is precious and to have a crew follow me round each improvement would have been expensive. The Inside Out package is about the state of cycling in the city, so just me peddling on my bike would be wouldn't have answered the general question 'Is Birmingham safe for cyclists?'. Instead this is a montage sequence with some on the spot conclusions at the end then plenty of context and 'right to reply' by the council.
I was pleased to see that my Belgrave Middleway coverage was used as a way to introduce but something my online footage allowed me to do was show the extent of the law breaking and to back that up with stats.
http://www.youtube.com/watch?v=lTPC_SqtmlQ
Within the confines of the TV programme you get an impression of what happened but you don’t get an in depth investigation. Furthermore, the point of Birmingham Cycle Data was to explore many cycle stories that affect Birmingham cyclists. It mainly using data visualisation to display how a question such as 'Is Birmingham safe for cyclists' is a complex one that can't have a simple answer.
I’d love the opportunity to now take the council cycling improvements story to my website. Ideally I'd display them on a map to visualise the scale of what the council has installed and where. Maybe even gather footage and evidence of me and others tackling them. This in conjunction with the larger exposure of BBC 1 programme would build up a more detailed picture of cycling improvements in the city and make suggestions how they could be further improved.
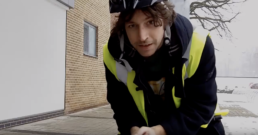
For now though you’ll have to just put up with my talking ‘helmet hair’ head.
The Final Stretch
For my MA Online Journalism assignment I chose to focus cycling, I tried to map some cycle data but then realised I was losing my audience. In the second phase I got back on track but still wanted to do good with my data. Especially when I noticed that my Birmingham Cycle Map had received over 1,100 hits.
Finding My Cycle Route
This is the second part of my assignment for my MA in Online Journalism. In the first part I explained how I was determined to graphically represent my data but as I read through Birmingham Cyclist Blog's noticeboard I felt I was losing contact with the community and the story.
Re:Cycling Experiment
If you’re a Hashbrum subscriber, or are a regular reader of this blog you may have noticed a recent obsession with cycling. The reason for this is it formed part of my MA Online Journalism Newsgathering Experimental assignment. Here it is, split into three parts.
Birmingham Safe Cyclist Map
As visitors to the HashBrum site might know I've been working on this map for a while now.
My FOI Request of cycling accidents and their locations came through and I was able to put the details straight into Mapalist. I exported as KML and re-imported but for some reason the details about the pins didn't copy.
So, even though these pins look a bit untidy in the larger map, they nevertheless should help cyclists take more care in accident areas.
The key is on the larger map but the general gist is:
Blue hued pin = cycle incident
Pink hued pin = cycle hazard
Primary colour = fatal accident
View Birmingham Cyclist Map in a larger map
Staying Updated
Through an RSS from FixMyStreet I've been tracking potholes that have been reported to Birmingham City Council and also pinpointing any potholes mentioned on the Council's Twitterstream. I will also be tracking my own cycle journeys and keeping an eye on any other hazards I see.
If you would like to add any hazards please feel free.
Bike Away From The Kerb
Robin PC contacted me through Help Me Investigate. Robin suggested I shouldn't just look at mapping data. He commented 'The safe way to cycle is to “get in the way”'. I put Robin's advice to the test, see how I got on:
Sprocket Cycles
I went to Sprocket Cycles, off Allison St Digbeth where Gordon quick-fitted a new bike chain in 3 minutes.
I also grabbed a short audio interview with Gordon talked about cycling safety, National 'Bike' Service and just what is the correct kerb distance?
Cycle Running
I decided it was about time to get out there and start tracking my own cycle routes. On the map below you can see my latest track. Click on the Recent Tracks tab and you can scroll through all my journeys as I wheel about, gathering cycle interviews and other usual daily Hashbrum business!
If you click through to Details beside each track, you can see I've written a short piece on each journey in my Notes section. These act as a summing up of my journey including any safety concerns I see. If you'd like to add your routes and comment on your experiences (and you have an Android or Smartphone) then this App should cost around £5.99. Once you've got it if you could let me know below and befriend me.
I'm also hoping to export this data and it will inform my next map based on experiences of people road cycling in Birmingham.
Find out about my first cyclemap here.


