This is the second part of my assignment for my MA in Online Journalism. In the first part I explained how I was determined to graphically represent my data but as I read through Birmingham Cyclist Blog’s noticeboard I felt I was losing contact with the community and the story.
This is the opposite of Foust and Hathaway:
“Not only can such interactivity increase the community’s interest in topics of importance, it also can increase the particular news organization’s standing in the community by providing a sense that it listens to its audience”(2005,13)
This was also confirmed with a post by Robin PC on the Help Me Investigate site. I realised that in pursuit of mashing-up available data, I had lost focus on why I was making the map. I responded to Robin’s post saying his comments would help my feature.
I took stock of my actions and put a summing up post on the HashBrum site. The purpose of this was to allow the public to see how I had reacted to various comments and what my plans were. I had to redesign the first post so that people visiting the site could navigate their own way.
“Because the Web can be either linear or non-linear, web journalists will have to understand both concepts and be skilled enough to present information in both forms.” (Stovall, Allyn and Bacon 2004, 42)
I cut the original post down to encourage contribution to the map still and provided a logo-link to SMIDSY.
“For the Web journalist, it needs to be lateral. The journalist needs to ask ‘How can the story expand?’”(Stovall, Allyn and Bacon 2004, 63)
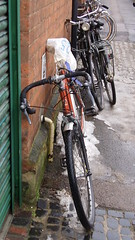
I decided to start gathering my own data and humanised my story by getting on my own bike, inspired by a feature in Guardian Society. I realised that an old bike that I inherited was perfectly adapted to snow conditions for reasons explained in the Audioboo. I was also playing with new technology having ordered an Android phone after Christmas. I attempted to take pictures from the journey and send them whilst cycling mobile via Pixelpipe and Tweetorium.
The idea was to not only give the story a human angle but also peak peoples’ interest. I teased Snow Bike on Twitter with links that lead to The Boo or pictures. In its raw form, this multimedia project lived on my blog. My bitly ratings were pushed up as other people on Twitter including @benjibrum and @kevingilmartin retweeted it. I also commented on the Guardian website which produced traffic for my site as well.
I installed an application onto my phone called Sportsrunner which tracked my journeys. Although it was a sporting device that highlighted speed trials and personal bests, it did allow for comment notes section. I was, therefore, able to write a little about each track and mention any hazards I saw. I then transposed these hazards onto the map. I put up a post on HashBrum and also encouraged people on the Birmingham Cycling site to contribute if they could get the technology.
I bought a Kodak Zi8 and decided that I would test Robin PC’s claim that the best way to avoid an accident is to make sure you are seen by motorists. He suggested cycling further away from the kerb, so I decided to put this to the test using a Flip Mount on my handlebars. I was on Snow Bike that day, which gave me something extra to talk about. I then edited the footage down and published it on YouTube. I also commented on a Podnosh post on Flip cameras which again drove some traffic to this site where I displayed the story alongside a map tracking my progress using VideMap. The story was fragmenting across platforms and I liked it.
“News, in other words, is no longer made up simply of a complete, self contained news item, but breaks into a series of primary reports (for example of updates as they unfold, or of various news items written from different perspectives) background information, discussion, commentary, and related and further information.” (Bruns 2005 218)
I tied various multimedia parts together on another HashBrum post, moving from mapping the stats to tracking my progress. I grabbed another perspective on safety and the kerb rule when I got my bike chain fixed. I then compiled my Robin PC footage together.
Find out how I finished my story but can’t stop pedalling in part three.
2 Comments
Comments are closed.

[…] Find out how I got back on my bike in part two. […]
[…] to focus cycling, I tried to map some cycle data but then realised I was losing my audience. In the second phase I got back on track but still wanted to do good with my data. Especially when I noticed that my Birmingham Cycle Map […]